Overview
We see our goals and the methodology for achieving them as an evolving centerpiece of the Global Biodiversity Visualization Project. Here is a summary of our current direction:
Goals
Methods
Document the current state of Earth's biodiversity as characterized by the distribution and abundance of a growing list of plant and animal species.
Create an online Global Biodiversity database and online community of ecologists and other scientists that can login and enter observational and modeling plant and animal data for sites around the world.
Connect climate change ecology modeling with current biodiversity measurements and projections.
Extend existing plant and animal modeling algorithms and code to explore impacts of projected climate and vegetation changes on animal populations.
Predict the trajectory of key species by reconstructing the past and projecting the future.
Collect paleoecological and paleoclimate reconstructions from data and modeling studies. Perform coupled climate-biosphere simulations to predict current & future biodiversity trajectories.
Visualize biodiversity and climate data and projected changes.
Construct a web mapping software stack to create online maps of plant and animal biodiversity as well as associated climate change maps.
Communicate global biodiversity projections to scientists, governments, and the public.
Build online bridges with related biodiversity and climate change websites managed by NASA, EPA, NGOs, and others. Provide state-of-the-art knowledge resources to governments and the public. Publish results in select online and printed journals.
1. Document biodiversity
Every endeavor has to start somewhere. Visualizing the trajectories of the Earth's major living species begins with documenting the current state of their populations.
- Key to optimizing our data infrastructure is choosing the best approaches and formats for storing and sharing data
- There are at least two pre-existing data formats initially being used on our team, reflecting the nature of taking site data in contrast with gridded modeling
- Geographically, site-specific data collection creates point data, while climate and ecological modeling generates gridded data
- The former is essentially vector data, while the latter is raster data
- Even after four decades, existing geospatial database management systems are mostly vector-based, designed to record and map "features" such as continental outlines, storing data in tables analogous to spreadsheets
- Earth system modeling has evolved in parallel, storing data in multidimensional arrays stored in files of various formats
- Our current site-specific (vector) animal (lizard) data are stored in Excel spreadsheets
- Our current modeled (raster) vegetation data are stored in NetCDF files that use HDF5 formatting
2. Connect plant and animal data and modeling
Effective interdisciplinary science requires building bridges between scientific regions and technological tools. We will connect our plant and animal research and expertise, as well as our empirical and modeling efforts.
- Include both plant and animal species and life forms (functional types) in the global biodiversity database
- Document known important plant-animal interactions and dependencies for current species list
- Explore ways to quantify these interactions and dependencies
- Construct algorithms that connect projected changes in plant species to current recorded animal populations
- Build new bridge models based upon these algorithms
3. Predict the trajectories of key species
The current state of biodiversity will be put in context by adding the fourth dimension. Connecting the past with the present and the future will reveal the conservation timescales for each of our key species.
- Explore connections between paleoclimate and past plant and animal distributions using published data
- Expand this exploration via modeling using GENESIS Earth system model combined with our ecological models
- Define ecological context for current species abundances by estimating past populations
- Perform climate-vegetation-animal simulations for the 21st century using IPCC climate change projections
4. Visualize biodiversity and climate
Transforming our science into visual maps will enhance our prospects for communication and collective action.
- Build primary website to support multi-user biodiversity database management and visualization
- Publish biodiversity and climate data using an Open Source map server such as Geoserver or Mapserver
- Write web applications that can transform published data into online maps using OpenLayers
- Create web maps for key endangered animal species and associated plant species and climate
Demonstration Earth map
I have created a prototype web mapping page to demonstrate the cool features of OpenLayers 3.0 alpha.
5. Communicate biodiversity projections
Scientific results and visualizations are transformed into education and policy by effective communication.
- Create software and web tools for communication and collaboration
- Maximize communication and collaboration between participating scientists and institutions
- Identify relevant communication portals, including select online and printed journals
- Publish annual summaries of growing body of biodiversity results in the literature
- Issue press releases
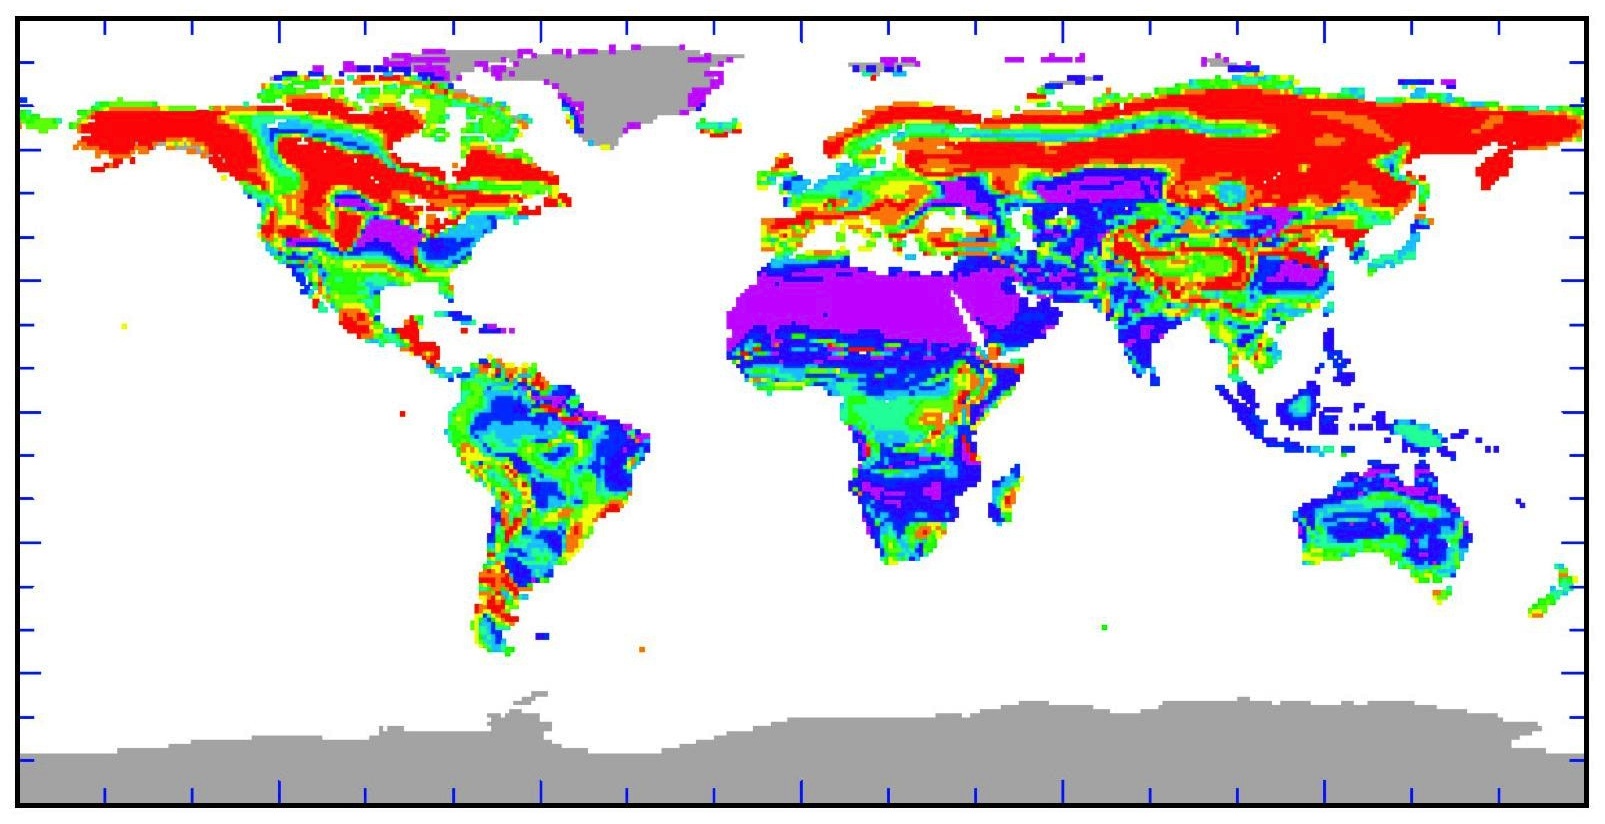
Ecological sensitivity map